Bile
Acid & GPCR TGR5 Bile Acids induce energy expenditure
by promoting intracellular thyroid hormone activation
While bile acids (BAs)
have long been known to be essential in dietary lipid
absorption and cholesterol catabolism, in recent years
an important role for BAs as signalling molecules has
emerged. BAs activate mitogen-activated protein kinase
pathways, are ligands for the G-protein-coupled receptor
(GPCR) TGR5 and activate nuclear hormone receptors such
as farnesoid X receptor alpha (FXR-alpha; NR1H4). FXR-alpha
regulates the enterohepatic recycling and biosynthesis
of BAs by controlling the expression of genes such as
the short heterodimer partner (SHP; NR0B2) that inhibits
the activity of other nuclear receptors. The FXR-alpha-mediated
SHP induction also underlies the downregulation of the
hepatic fatty acid and triglyceride biosynthesis and
very-low-density lipoprotein production mediated by
sterol-regulatory-element-binding protein 1c. This indicates
that BAs might be able to function beyond the control
of BA homeostasis as general metabolic integrators.
Here we show that the administration of BAs to mice
increases energy expenditure in brown adipose tissue,
preventing obesity and resistance to insulin. This novel
metabolic effect of BAs is critically dependent on induction
of the cyclic-AMP-dependent thyroid hormone activating
enzyme type 2 iodothyronine deiodinase (D2) because
it is lost in D2-/- mice. Treatment of brown adipocytes
and human skeletal myocytes with BA increases D2 activity
and oxygen consumption. These effects are independent
of FXR-alpha, and instead are mediated by increased
cAMP production that stems from the binding of BAs with
the G-protein-coupled receptor TGR5. In both rodents
and humans, the most thermogenically important tissues
are specifically targeted by this mechanism because
they coexpress D2 and TGR5. The BA-TGR5-cAMP-D2 signalling
pathway is therefore a crucial mechanism for fine-tuning
energy homeostasis that can be targeted to improve metabolic
control.
Watanabe M, et al. Nature.
2006 Jan 26;439(7075):484-9. Epub 2006 Jan 8.
Metabolism: Bile acids heat
things up
Thyroid hormone causes fat loss, but harnessing
this action to treat obesity is difficult because it is
associated with harmful side effects. However, bile acids
generate active thyroid hormone just where it is needed.
John
D. Baxter and Paul Webb. Nature439, 402-403 (26
January 2006)
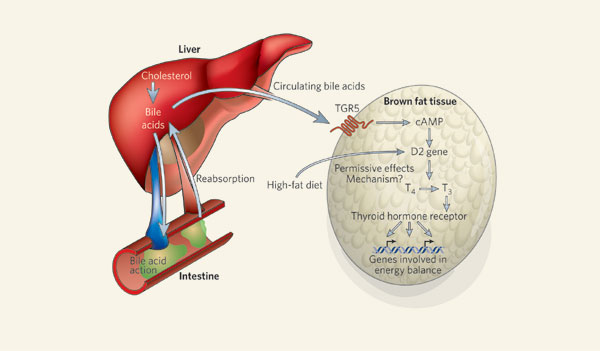
Bile
acids are synthesized from cholesterol in the liver,
stored in the gallbladder, and secreted after meals
to promote absorption of fat from the intestine. They
are then either excreted or reabsorbed into the circulation.
Watanabe et al.3 demonstrate
that bile acids increase the metabolic rate in fat cells
by binding to a G-coupled protein receptor (TGR5) that
increases cAMP content and induces D2 expression, thereby
enhancing local conversion of T4 to the active T3. These
effects are observed only in animals that are fed a
high-fat diet, as this sensitizes the D2 response to
bile acids through an unknown mechanism. John D. Baxter and Paul Webb.
Nature 439,
402-403 (26 January 2006)
Regulation of bile
acid metabolism by nuclear receptors. Bile acid synthesis
is stimulated by LXR in rodents. Negative feedback regulation
of bile acid synthesis is mediated by FXR. FXR represses
bile acid import in hepatocytes and stimulates their
biliary excretion. FXR induces the expression of the
intestinal bile acidbinding protein. PXR and VDR are
involved in detoxification of secondary bile acids.
a,
b, Change in cumulative
food intake (a)
and body weight (b)
of C57BL/6J mice over 47 days. Squares, chow (Ch); circles,
HF diet (F); triangles, HF diet plus CA (FA). c,
Comparison of epididymal WAT (epWAT). d,
Changes of body weight in C57BL/6J mice. After 120 days
half of the mice on the HF diet (filled triangles) were
switched to HF diet supplemented with CA. Other symbols
as in a. e,
Comparison of epWAT weights. F-FA, switched to HF diet
supplemented with CA. f,
Food intake and body weight (BW) of C57BL/6J mice after
1 month on diets containing natural CA or synthetic
(GW4064) FXR-alpha agonist (FG, HF plus GW4064). g,
Composition of BAs in enterohepatic organs and serum
of KK-Ay mice after 21 days on the indicated diets.
Abbreviations: Glyco (G), Hyo (H), Urso (U) and Muri
(M). Error bars show s.e.m. ChA, chow diet supplemented
with cholic acid. Watanabe
M., et al. Nature 439,
484-489 (26 January 2006)
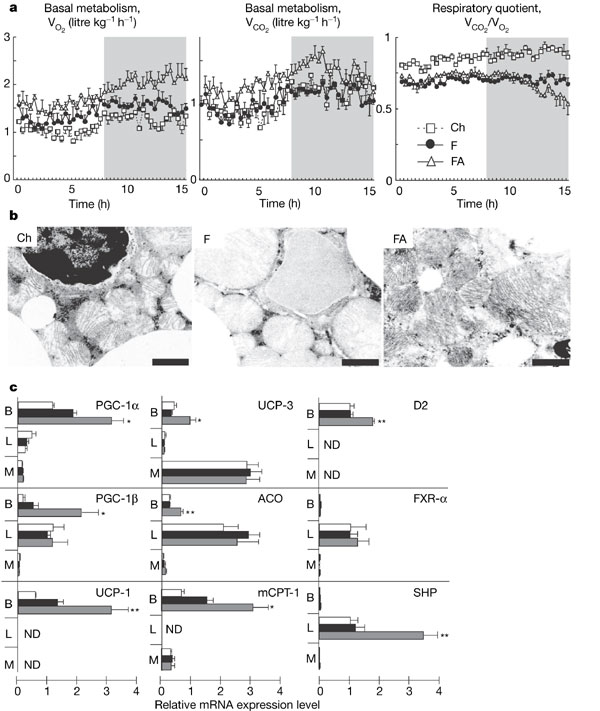
O2 consumption, CO2
production and RQ in mice on different diets for 4 months
(C57BL/6J, n = 3, age 26
weeks). The acclimation time was 2 h. O2 consumption
was normalized to (body weight)0.75. The shaded area
indicates the dark phase. Squares, chow (Ch); circles,
HF diet (F); triangles, HF diet plus CA (FA). b,
BAT analysis by transmission electron microscopy. Scale
bar, 1 m.
c, Relative mRNA
expression levels of PGC-1,
PGC-1,
UCP-1, UCP-3, ACO, mCPT-I, D2, FXR-
and SHP in BAT (B), liver (L) and muscle (M). ND, not
detectable. White bars, chow; black bars, HF diet; grey
bars, HF diet plus CA. Error bars show s.e.m. Watanabe
M., et al. Nature 439,
484-489 (26 January 2006)
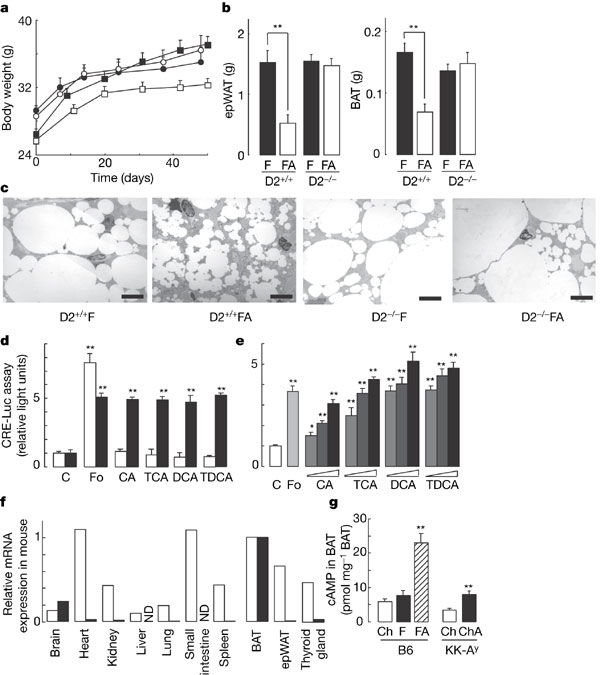
a,
Body weight change in D2+/+
and D2-/- mice over 50
days. Filled squares, D2+/+,
HF diet (F); open squares, D2+/+,
HF diet plus CA (FA); filled circles, D2-/-,
F; open circles, D2-/-,
FA. b, Comparison
of the weights of epWAT and BAT. c,
Osmium-tetroxide-stained BAT was analysed by transmission
electron microscopy. Scale bars, 5 m.
d, CRE reporter
assay in CHO cells transfected with pCRE-Luc and TGR5
expression vector. Concentrations: 100 M
BA, 5 M
forskolin (Fo). C means control. Open bars, vector;
filled bars, pTGR5. e,
CRE reporter assay in CHO cells transfected with pCRE-Luc
and TGR5 expression vector in the presence of different
concentrations (1.8, 5.5 and 17 M)
of the indicated BAs. f,
Expression of TGR5 (open
panels) and D2 (filled
panels) in selected mouse tissues. ND, not detectable.
g, cAMP levels
in BAT of C57BL/6J and KK-Ay mice after 7 days on the
diets. Ch means chow and ChA means chow + CA. Error
bars show s.e.m. Watanabe
M., et al. Nature 439,
484-489 (26 January 2006)
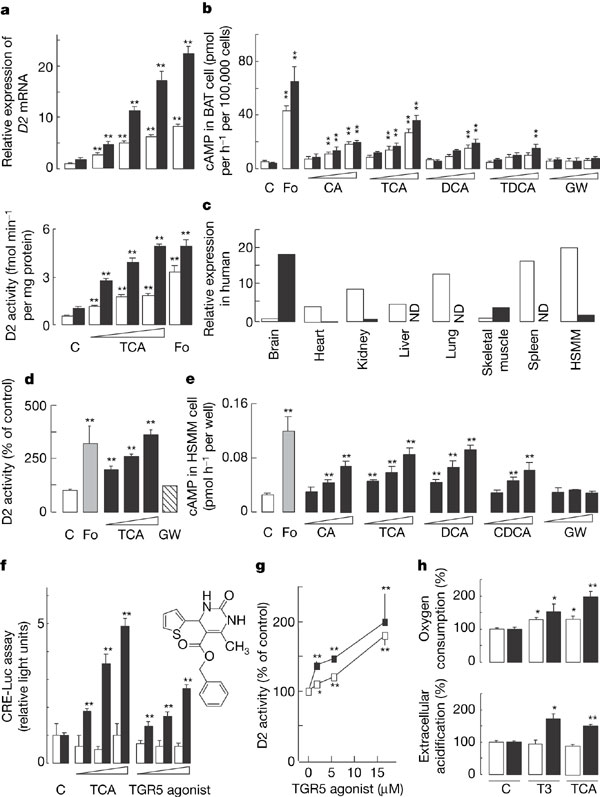
a,
D2 expression (upper panel)
and D2 activity (lower panel) in BAT cells from C57BL/6J
mice after 14 days on chow (open columns) and HF diet
(filled columns). Cells were treated with TCA or forskolin
(Fo) (as in Fig. 3e). b,
Induction of cAMP by BAs in BAT cells (as in Fig. 3e).
GW, GW4064 at 1.1, 3.3 and 10 M.
Open columns, chow; filled columns, HF diet. c,
Expression of TGR5 (open
columns) and D2 (filled
columns) in selected human tissues. ND, not detectable.
d, Induction of
D2 activity in HSMM by TCA (1.3, 4 and 12 M),
GW4064 (3 M) and forskolin (10 M).
e, Induction of
cAMP by BAs in HSMM (as in b).
f, CRE reporter
assay (as in Fig. 3d). Agonists were used at 1, 3.2
and 10 M.
Open columns, vector; filled columns, pTGR5. The structure
of benzyl 2-keto-6-methyl-4-(2-thienyl)-1,2,3,4-tetrahydropyrimidine-5-carboxylate
is also shown. g,
Induction of D2 activity in HSMM by the synthetic TGR5
agonist (1, 5 and 15 M)
in the absence (open columns) or presence (filled columns)
of 1 mM IBMX. h,
Induction of oxygen consumption (upper panel) and extracellular
acidification rate (lower panel) in HSMM by 5 M
TCA and 50 nM T3. Open columns, 48 h; filled
columns, 72 h. Error bars show s.e.m. Watanabe
M., et al. Nature 439,
484-489 (26 January 2006)
Bile acids promote glucagon-like
peptide-1 secretion through TGR5 in a murine enteroendocrine
cell line STC-1
Bile acids play essential
roles in the absorption of dietary lipids and in the
regulation of bile acid biosynthesis. Recently, a G
protein-coupled receptor, TGR5, was identified as a
cell-surface bile acid receptor. In this study, we show
that bile acids promote glucagon-like peptide-1 (GLP-1)
secretion through TGR5 in a murine enteroendocrine cell
line STC-1. In STC-1 cells, bile acids promoted GLP-1
secretion in a dose-dependent manner. As STC-1 cells
express TGR5 mRNA, we examined whether bile acids induce
GLP-1 secretion through TGR5. RNA interference experiments
showed that reduced expression of TGR5 resulted in reduced
secretion of GLP-1. Furthermore, transient transfection
of STC-1 cells with an expression plasmid containing
TGR5 significantly enhanced GLP-1 secretion, indicating
that bile acids promote GLP-1 secretion through TGR5
in STC-1 cells. Bile acids induced rapid and dose-dependent
elevation of intracellular cAMP levels in STC-1 cells.
An adenylate cyclase inhibitor, MDL12330A, significantly
suppressed bile acid-promoted GLP-1 secretion, suggesting
that bile acids induce GLP-1 secretion via intracellular
cAMP production in STC-1 cells.
Katsuma S, Hirasawa A, Tsujimoto
G. Biochem Biophys Res Commun. 2005 Apr 1;329(1):386-90
A G protein-coupled receptor responsive
to bile acids
So far some nuclear receptors for bile acids
have been identified. However, no cell surface receptor
for bile acids has yet been reported. We found that a
novel G protein-coupled receptor, TGR5, is responsive
to bile acids as a cell-surface receptor. Bile acids specifically
induced receptor internalization, the activation of extracellular
signal-regulated kinase mitogen-activated protein kinase,
the increase of guanosine 5'-O-3-thio-triphosphate binding
in membrane fractions, and intracellular cAMP production
in Chinese hamster ovary cells expressing TGR5. Our quantitative
analyses for TGR5 mRNA showed that it was abundantly expressed
in monocytes/macrophages in human and rabbit. Treatment
with bile acids was found to suppress the functions of
rabbit alveolar macrophages including phagocytosis and
lipopolysaccharide-stimulated cytokine productions. We
prepared a monocytic cell line expressing TGR5 by transfecting
a TGR5 cDNA into THP-1 cells that did not express TGR5
originally. Treatment with bile acids suppressed the cytokine
productions in the THP-1 cells expressing TGR5, whereas
it did not influence those in the original THP-1 cells,
suggesting that TGR5 is implicated in the suppression
of macrophage functions by bile acids.
Kawamata
Y, et al. J Biol Chem. 2003 Mar 14;278(11):9435-40
TGR5 as a specific cell surface receptor for bile acids.A, internalization of TGR5 induced by TLCA. The
left panel shows CHO cells expressing TGR5-GFP.
The right panel shows CHO cells expressing TGR5-GFP
after treatment with TLCA (50 µM) for 30 min.
Bars indicate 4 µm. B, TLCA-induced
[35S]GTPS
binding to membrane fractions of CHO-TGR5. Binding of
[35S]GTPS
to TGR5-CHO cell ()
and mock CHO cell ()
membrane fractions was determined in the binding buffer
containing 30 µM GDP and the indicated concentrations
of TCLA. The increase in [35S]GTPS
binding was indicated as ratios of total binding to basal
binding. Data represent the mean ± S.E. in three
independent experiments of triplicate assays. C,
extracellular signal-regulated kinase MAP kinase activation
in CHO-TGR5 cells by TLCA. CHO-TGR5 or mock CHO cells
were subjected to Western blot analysis after treatment
with TLCA (2 µM) for the indicated periods. J. Biol. Chem., Vol. 278, Issue
11, 9435-9440, March 14, 2003
Promotion of
cAMP production in CHO-TGR5 cells by bile acids.A, dose-responsive analyses for cAMP production
induced by bile acids. The inset shows the
chemical structure of major bile acids. B,
comparison of cAMP production stimulatory activities
in bile acids and in related compounds. CHO-TGR5 cells
were treated with the indicated compounds at 2 µM.
T, taurine-conjugated; G, glycine-conjugated;
F, free. Data represent the mean values ± S.E.
(n = 3) of percentages in cAMP production
in LCA at 10 µM. UDCA, ursodeoxycholic
acid; TTNPB, (E)-([tetrahydrotetramethylnaphthalenyl]propyl)benzoic
acid.
Distribution
of TGR5 mRNA.A, expression of TGR5
mRNA in human tissues. B, expression of TGR5
mRNA in fractionated human leukocytes. C, tissue
distribution of TGR5 mRNA in rabbit tissues. Poly(A)+
or total RNA preparations were subjected to quantitative
reverse transcription-PCR using a ABI Prism 7700 sequence
detector. Each column represents the mean value
in duplicate determinations.
Amino acid sequences of human, bovine,
rabbit, rat, and mouse TGR5. Residues identical
in at least two sequences are boxed. The predicted
seven-transmembrane domains (TM1-7) are indicated
in bars above the sequences (27). The
nucleotide and amino acid sequence data for human, bovine,
rabbit, rat, and mouse TGR5 cDNAs appear in the DDBJ/EMBL/GenBankTM
data base with accession numbers AB089307, AB089306, AB089309,
AB089310, and AB089308, respectively.


